Scientific Workflows, Image Analysis, and Visual Stylometry in the Digital Analysis of Art
Abstract
The goal of the project is to develop a tool called WAIVS (Workflows for Analysis of Images and and Visual Stylometry) for digital image analysis of paintings that is powerful enough to support advanced research in computer science, cognitive science, art history, and the philosophy of art while providing an accessible interface that can be used by researchers or students with little or no computer science background. The WAIVS we envision will implement a broad range of digital image analysis algorithms as scientific workflows using the WINGS semantic workflow system. Scientific workflows allow users to build programs like one would draw a flowchart, dragging shapes representing data sets and image analysis procedures onto the workspace and drawing links between them. WAIVS can be used to promote computational literacy and data analytic skills among humanities students, introduce science students to research in art and the humanities, and help us understand how viewers perceptually categorize/recognize paintings and otherwise engage with artworks.
Introduction
There is a growing interest in applications of data analysis tools within disciplines traditionally associated with the humanities. Here, we introduce a set of tools that we are developing for what has come to be called Visual Stylometry. Visual stylometry applies techniques and procedures from digital image analysis to questions about the nature of artistic style and how expert knowledge of artistic style drives our interactions with, and understanding of, works in a variety of different media.
We start with an illustration of the application of digital image analysis tools in painting, here Albert Bierstadt's The Morteratsch Glacier, Upper Engadine Valley, Pontresina 1885 (The Brooklyn Museum — see http://www.wikiart.org/en/albert-bierstadt/the-morteratsch-glacier-upper-engadine-valley-pontresina-1895). Although our illustration is limited to a single artwork, the tool under development has the potential to analyze data sets that include thousands of images. We can also extend the range of computational analyses included in WAIVS to include classification, social network analyses, topic analyses, etc.
Once we select our sample artwork, the Bierstadt, we can run it through some computational analyses in order to end up with quantitative results germane to our research question, e.g. what sorts of image features allow us to sort paintings by artist, school, movement, or etc.

Original image of Albert Bierstadt's The Morteratsch Glacier, Upper Engadine Valley, Pontresina 1895
A user could choose to put the piece through a particular computational process, for instance, Discrete Tonal Measure. This algorithm analyzes individual pixels of an image and calculates the tonal variation relative to their neighboring pixels. Theoretically, a small region of an image having little variation of discrete tonal features will have a more shaded appearance, while a small area having wide variation will have a dominant textural appearance.
Artists within a given school of painting share a style by virture of sharing similar formal, compositional, and productive techniques. One might assume that these similarities in productive practice should support similarities in texture among the works of members within a stylistic category. Discrete tonal measure is a means to test th related hypothesis that texture is a quantifiable measure of artistic style.
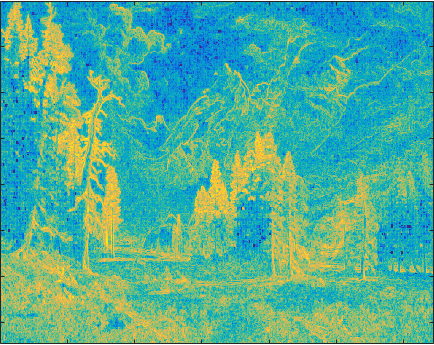
The output of a discrete tonal measure analysis is either a value or an image. The value is the average standard deviations of all the neighborhoods. The image, as seen below, is a normalized image in which pixels represent the standard deviation of the neighborhood (darker implies less variance and lighter implies more variance):

Discrete Tonal Measure
Or, the user could first choose to apply the foreground or background extraction tool. Why might this be of interest? We might make an assumption that the background of a painting is a region that is more uniformly rendered, or where local image variance more strongly reflects the style of the artist than the particular depictive or representational goals of the painting. If this assumption is sound we may expect to find stronger stylistic cues in the background than the foreground.
Or one might argue that the strongest cues to artistic style are in the way the artist worked the canvas to realize the representational goals of the painting. Here one would want to focus their image analysis on foreground features.
A foreground/background analysis is:

Foreground/Background Extraction Tool
The user could then run a second computational analysis, in this case a standard deviation computation, on the same pixel neighborhood.
There is an option for user input here. We don't want to sway the data on these edge points. In the table below, the T=1, T=.67, T=.5 were values used to remove some of the "noise" that is not really in the background or foreground and should not be counted (like the lines in the black in the picture above or the specks in the sky in the foreground picture). Those values are thresholds.
For T=1, that means every pixel around you must also be in the same category (foreground or background) in order to be counted. T=.67 implies that if 2/3 of the pixels are in the same category, then use just those pixels and compute a standard deviation. Similarly with T=.5. We found T=.67 was suitable and accurate to keep enough data and not lose edge data, but also not introduce false pieces.

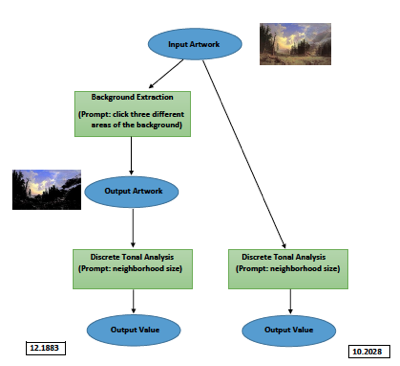
Quantitative results for Bierstadt-1895 analysis
Scientific Workflows
Although such computational techniques have proven to be effective in visual stylometry, there is a significant hurdle to introducing them as a general research tool in the humanities in classroom contexts: there is often a pre-requisite expertise in the tools and applications of machine learning algorithms. Until recently, artists and art historians without such expertise, or access to relevant experts like computer scientists, simply could not use these advanced computational tools to help tame the analysis of their collections.
We propose to implement a broad range digital image analysis tools as scientific workflows using the Wings semantic workflow system. Scientific Workflows allow non-computer-scientists to represent a suite of advanced algorithms as simple, individual graphical boxes. Artists and art historians can then create complex programs by just connecting these boxes without ever delving into the details of how these algorithms are implemented.
We could use scientific workflows to represent the above analyses. E.g., the above analysis could be represented abstractly:

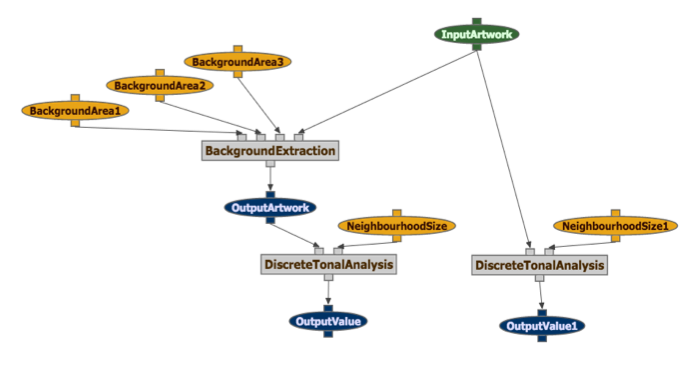
The corresponding scientific workflow for this analysis of the Bierstadt painting would be:

The goal of this project is to make these powerful image analysis tools accessible to a broad range of non-experts, to bring them to practitioners in arts related fileds with little or no computer science background.
We plan to implement the broad range of image analysis algorithms currently employed in the visual stylometry literature (e.g., Discrete Tonal Measure and Standard Deviation as above). The resulting tool will include detailed descriptions explaining what these tools do in language accessible to non-mathematicians. Descriptions will include components describing how art historians and computer scientists have used these image analysis tools in practice and instructions for constructing one's own image analysis tool by connecting elements within a workflow to form a complete program that will analyze their own data collections.
Workflows are a way to represent complex programs as small, graphical boxes which can be linked together to make it easier to carry out complex analyses using machine learning algorithms. Historians can simply point-and-click with a mouse to manipulate these graphical boxes without needing to know the implementation details of the underlying machine learning algorithms.
Examples of additional workflows: The workflow on the left analyzes text and image data in posts made on community ad sites. The workflow on the right analyzes the topics in thousands of answers posted on the scientific website, The Madsci Network. Both workflows are composed of graphical boxes that encapsulate complex machine learning algorithms (e.g., the box entitled TrainTopics in the workflow on the right represents a Latent Dirichlet Allocation topic model).

Technical Information: scientific workflows capture an end-to-end analysis composed of individual analytic steps as a dependency graph that indicates dataflow links as well as control flow links among steps. They represent complex applications as a dependency network of individual computations linked through control or data flow. Scientific workflows have been widely used to create reproducible and reusable research in fields such as Genomics, ChemInformatics, GeoInformatics, Astronomy, and Text Analytics.
The particular workflow infrastructure we use is Wings, which has three key features that make workflows accessible to humanities researchers: a simple dataflow structure, a simple web interface, and the ability to publish workflows as web objects. This framework provides a common, structured mechanism to compose algorithms and methods for analysis that is easily extensible to incorporate new algorithms and methods and to process additional types of data.